UML diagrams for the Online Electricity Bill Management project. Following are the different UML diagrams like Components, Activity, Use Case, and Sequence diagrams of the online electricity bill management.
The Electricity Billing System will assist in managing the operations related to billings with more accuracy and efficiency.
UML Diagram for Online Electricity Bill Management System
We’ve compiled structural UML diagrams i.e. component diagrams, and three types of behavioural UML diagrams i.e. Activity, Sequence, and Use Case diagrams for the Online Electricity Bill Management Project. We have also explained the data flow diagram (DFD) for this project.
The electricity bill management system project is a web application that is developed to automate the billing system of the electricity board. Admin is who will manage the overall application; whereas the user or customers can pay their electricity billss.
Component diagram for Online Electricity Bill Management System
The diagram below shows the structural relations between components in an Online Electricity Bill Management system. The connected components by lines represent relationships within the systems. In the diagram, it can be seen that there are components namely electricity bill management, bill, user, and account.
It shows how the customer component connects to the other components while using the system. Everything from the account details to product booking to payment flow can be seen in the component diagram.
Admin is the primary user. Admin can Add/Remove/Update any details related to the system, maintain electricity usage database, generate bills & invoices for the users, and View/Confirm/Cancel registration requests by Users, etc. Admin can calculate bills.
Users can view the bill and check the due date all the details like start date, end date total consume electricity units ETC and process the payment. And Also the user can check the history of transactions.

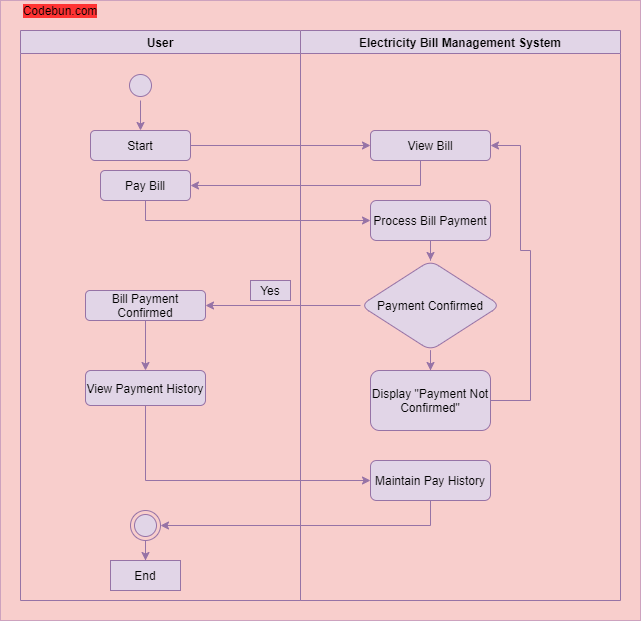
Activity diagram for Online Electricity Bill Management Project
Activity diagrams in UML display the functionalities of various activities and flow in management processes and software systems. The flow in the activity diagram can be sequential, branched, or concurrent.
Admin will be responsible for maintaining the system and also, keeping a check on users, billings, payments, generating invoices for users, etc.
On the other hand, Users can register, log in using the login credentials, and pay their monthly electricity bills online. Users can view the bill and check the due date all the details like start date, end date total consume electricity units ETC and process the payment. And Also the user can check the history of transactions.
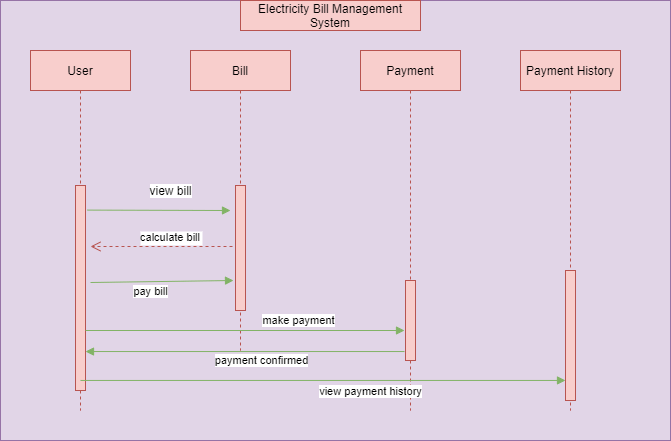
Sequence diagram for Online Electricity Bill Management Project
Sequence diagrams in UML are used to illustrate the sequence of messages between objects in an interaction. A sequence diagram consists of a group of objects that are represented by lifelines and the messages that they exchange overtime during the interaction.
Users can register on the portal using their name, address, and other valid details, view their electricity bill, pay online, download bills & invoices, etc. After logging in, users can find detailed information about the calculated charges & taxes included in the bills, data consumption, pending bills, etc on the system after logging in.
Use Case Diagram for Online Electricity Bill Management Project
A UML use case diagram can create a broad, high-level view of the relationship between use cases, actors involved, and systems being performed.
As you can see from the examples below, use cases are represented by oval shapes, and the lines then show at which point an actor/user participates and interacts with their corresponding use case. You can see where each actor is involved within the entire process (and where they’re excluded).
For example, Admin will be able to calculate bills, add users, manage pay history, and view bill reports in the system. Whereas, users can access the system for paying their electricity bills.

DFD Diagram for Online Electricity Bill Management Project
A data flow diagram represents the flow of information for any process or system. It shows the system with its relationship to external entities. Here, we can see how the users and the process flow work in a system.
Admin can collect electricity data usage of users for billings, generate bills & invoices for the user, manage Users, View/Confirm/Cancel registration requests, manage bills & payments, etc.
Users can Manage “My profile” and download bills & invoices. Users can pay Electricity bills online and can make payments online. Users can change passwords.

Click here to get the source code