UML diagrams for the Online Survey project. Following are the different UML diagrams like Components, Activity, Use Case, and Sequence diagrams of the online survey system.
UML Diagram for Online Survey System
We’ve compiled structural UML diagrams i.e. component diagrams, and three types of behavioural UML diagrams i.e. Activity, Sequence, and Use Case diagrams for the Online Survey Project. We have also explained this project’s data flow diagram (DFD).
With the help of these diagrams, one can understand the project better. This web application is developed to reduce the paper consumption for conducting the surveys and want to provide a survey portal where the surveys will be held.
Component diagram for Online Survey System
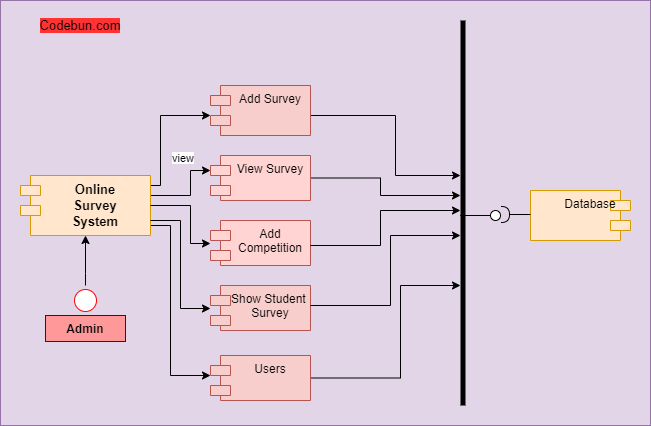
The component diagram below shows the structural relations between components in an Online Survey system. The connected components by lines represent relationships within the systems.
In the diagram, it can be seen that there are components namely add a survey, users, add competition, FAQ, etc. It shows how all components will work in the system.
Online Survey Portal project application where we wanted to reduce the paper consumption for conducting the surveys and want to provide a survey portal where the surveys will be held. The complete process of the Environment Survey Portal will be managed online. There is no need to maintain the record manually.
Activity diagram for Online Survey System
Activity diagrams in UML display the functionalities of various activities and flow in management processes and software systems.
In Online Survey System, Admin can manage the surveys and their details. Admin can add different users like faculty, staff, and students. Admin can update all surveys and competition detail. Admin can view registrations and its detail. Admin can accept or decline registrations.

Sequence diagram for Online Survey System
Sequence diagrams in UML are used to illustrate the sequence of messages between objects in an interaction. A sequence diagram consists of a group of objects represented by lifelines and the messages they exchange overtime during the interaction.
We can see from the diagram that Admin and Faculty have the ability to add surveys for students. Whereas, Students can just apply for the surveys. Admin can add Students and Faculty to the system. Faculty cannot add students. Instead, Faculty can just view students’ survey details.

Use Case Diagram for Online Survey System
A UML use case diagram can create a broad, high-level view of the relationship between use cases, actors involved, and systems being performed.
As you can see from the examples below, use cases are represented by oval shapes, and the lines then show at which point an actor/user participates and interacts with their corresponding use case. You can see where each actor is involved within the entire process and where they’re excluded.
For instance, Admin will be able to add users, surveys, and details into the system. Whereas, students cannot add users or surveys, but can access the system for applying and taking surveys. On the other hand, the Faculty can add surveys and competitions.

DFD for Online Survey System
A data flow diagram represents the flow of information for any process or system. It shows the system with its relationship to external entities. Here, we can see how the users and the process flow work in a system.
Admin will be able to add users, surveys, and details into the system and can view the Support Page and FAQs for any issue faced by the users.
Faculty can add surveys and competitions and Students can view surveys and apply for a particular survey.

Click here to get the source code for Online Survey System in Java